

In a competitive eCommerce landscape, brands struggle to get noticed due to fierce competition for organic ranking and sponsored ads. If you’re vying to boost visibility, dominate your category, and succeed on Amazon, it is crucial that you think beyond ROAS and start tracking Share of Voice (SOV) and Share of Self (SOS).
Both metrics confuse many Amazon sellers due to conventional shelf analytics in brick-and-mortar stores, and organic visibility on the digital shelf. Today, we understand the difference between both metrics and how you can leverage them to understand your market share better.
What is Amazon Share of Voice?
Amazon Share of Voice (SOV) is the percentage of your brand’s market share visible on the first page through paid traffic. SOV depends on how much you spend on sponsored products, brands, and video ads.
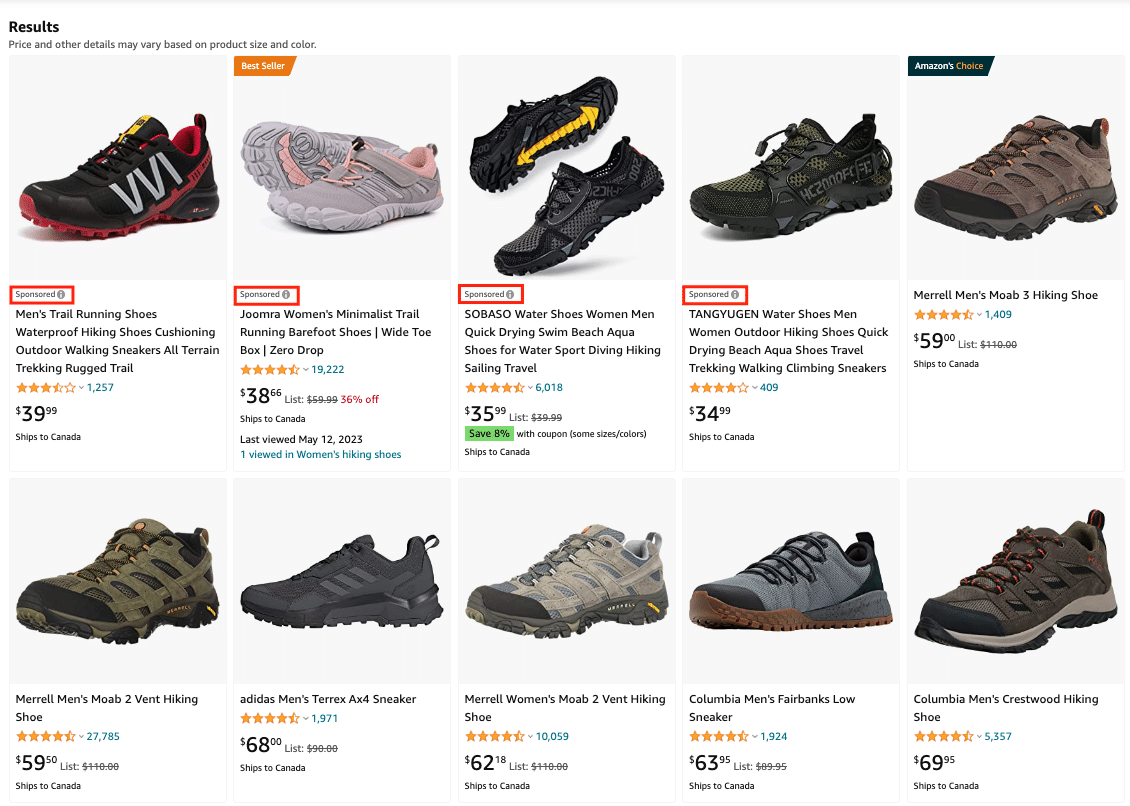 The sponsored ads by brands are aimed to increase their Share of Voice and be more visible in the search results. If we take a sample size of 4 sponsored results, Joomra has a Share of Voice of 25% as it has 1 search result on the keyword ‘hiking shoes’.
What is Amazon Share of Shelf?
Amazon Share of Shelf is the percentage of your brand’s market share visible on the first page through paid and organic traffic. SOS depends on how well your products rank organically and your ad campaigns perform.
 ASICs has 1 product sponsored and 1 product organically ranking. If we calculate from the search result of 10 sample size, ASICs has 20% Share of Shelf.
If your SOS is low, in the short run, you can increase ad spend, and in the long run, you can improve searchability for visibility. If you have a high SOS, you can lower your spending, leverage organic visibility, and improve conversion rate.
What is the difference between Share of Voice and Share of Shelf?
Your SOV and SOS reflect your brand’s ability to dominate on Amazon, own customer dialogue, and appear visible to the target demographic. However, there is a fundamental difference between the two. SOS considers both organic traffic and paid traffic and SOV considers only paid traffic.
Furthermore, SOS compares product listings for market share based on keywords, categories, or brands. SOV compares advertising campaigns including sponsored products, brands, and video ads.

Why are Share of Voice and Share of Shelf critical?
Share of Shelf and Share of Voice are important for your eCommerce merchandising strategy for various reasons such as tracking visibility, product demand, and stealing customers.
Tracking your brand visibility
More than 70% of Amazon customers do not browse past the first page of search results. It means if you are not on the first page of Amazon search results, the sales of your Amazon store will be low due to poor visibility.
SOV and SOS track brand awareness and top-of-the-funnel traffic before your customers make purchases down the funnel. If you have high visibility on the first page or the top results, you can expect sales through your top keywords. If your product is struggling with visibility on the top results through either sponsored ads or organic ranking, it will affect your sales.
Understanding product demand
Sellers can find out if their brand visibility against competitors changes when product demand increases or decreases. It is important for sellers to know if a low demand for a product or category is impacting their brand more than the competitors.
If the search volume for a product is dropping due to seasonality or trends, it may mislead you into thinking that your campaign is underperforming, and vice versa.
For instance, if your sales and visibility are dropping, it might indicate your ad is performing poorly. However, it could be that overall demand for the product is declining and changes in customer behavior are restraining your budget to low visibility. This may trick you to solve a problem by increasing the budget on an out-of-trend product. Therefore, comparing your performance against the market, brand, or category will help you make better decisions for your business.
Stealing customers
Brands can understand if competitors are trying to get SOV on their brand name search and trying to steal their customers.
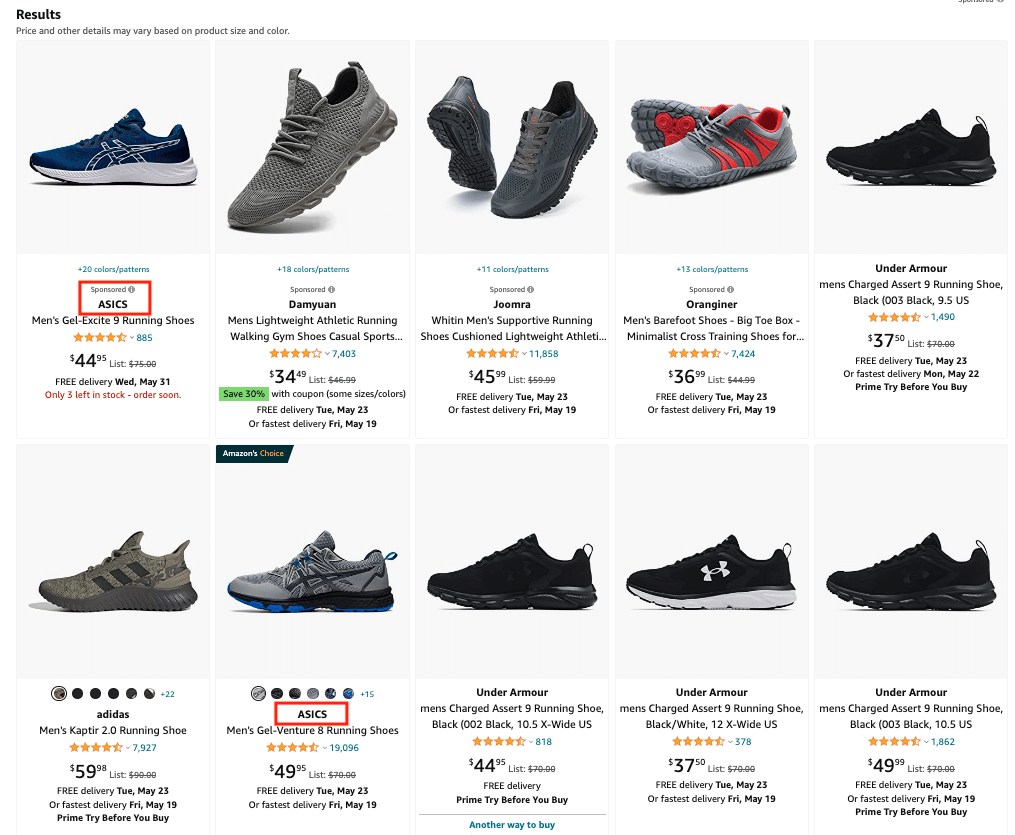
 Amazon search for ‘ASICS men’ shows sponsored ad results of two competitors.
In this small sample size, we can see ASICS has an SOS of 80% on their brand search term. ASICS may consider increasing its SOS through sponsored campaigns to stop customers from getting distracted by other brands and losing sales to them.
How can you improve your Share of Shelf and Share of Voice?
There are certain multi-functional actions you can take to help you with visibility, organic growth, and dominating your category.
SOV: Increase ad budget
One of the easiest ways to improve your SOV and SOS is by increasing your ad budget. More budget will allow you to bid more on your ad campaigns, and be more visible. If your product is in the launch phase, it won’t have a ton of organic traffic, therefore, allocating the budget by identifying the most relevant keyword will help increase SOV.
If your product is in the growing or maturity stage, you want to track SOS and SOV to understand if your dominance for visibility is maintained as other brands would keep competing on your top keywords.
SOV: Optimize top keywords
Brands can optimize their ad campaigns to get a higher SOV while keeping the same budget. One of the ways is allocating the budget between products, keywords, and campaigns that give the most visibility. You can divide your top keywords into a set of branded, most relevant, and competitor keywords, and optimize campaigns by either bidding aggressively or reallocating budget.
- Branded keywords would make it difficult for competitors to steal your customers.
- Most relevant keywords (non-branded) would be the top keywords that are most relevant to your product or brand.
- Competitor keywords will enable you to show products on your competitors’ brand names and convert well if your product is better.
Caption: Digital Shelf in Trellis Advertising Module
For example, you are selling running shoes and identify 5 keywords using search term report including short-tail and long-tail keywords that have the most relevance to one of you running shoes for men. You can create a shelf to track the dominance of those keywords.
To test SOV, you can create an ad campaign on the targeted keywords. Similarly, you can also optimize those keywords in the product listing for organic growth or SOS.
SOS: Improve the conversion rate
If the conversion rate is high, SOS will significantly improve. Conversion rates are a huge factor in organic ranking. When a customer is more likely to buy your product after a search query, the Amazon A9 algorithm takes it as a strong signal to improve ranking.
Better organic ranking will improve visibility, and take some pressure off the sponsored ad to dominate the SOS. Improving the conversion rate allows you to allocate a budget to other campaigns that require a budget to dominate a category. Overall, a better conversion rate can help you increase SOS and SOV for products that do not have enough visibility.
How to monitor your Share of Voice and Share of Shelf?
Tracking your SOV and SOS for several keywords, products, and campaigns can be time-consuming. The most effective way to monitor both metrics is by using data analytics tools that automatically take input from your organic and paid traffic to build data visualizations.
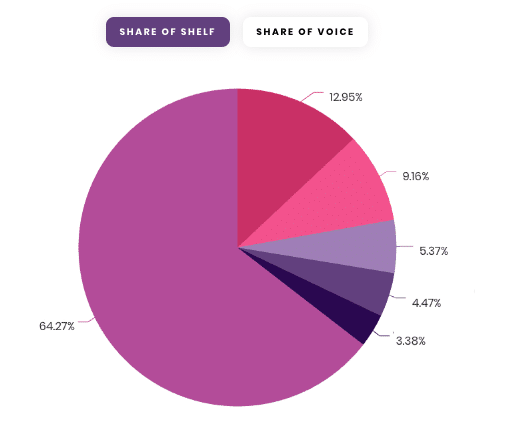
Trellis’ eCommerce merchandising platform provides Share of Voice and Share of Shelf for the first page and above the fold (top 8 results).
You can view a snapshot of your Share of Voice and Share of Shelf.
Or you can view a time of both metrics to understand your dominance on your top keywords targeted.
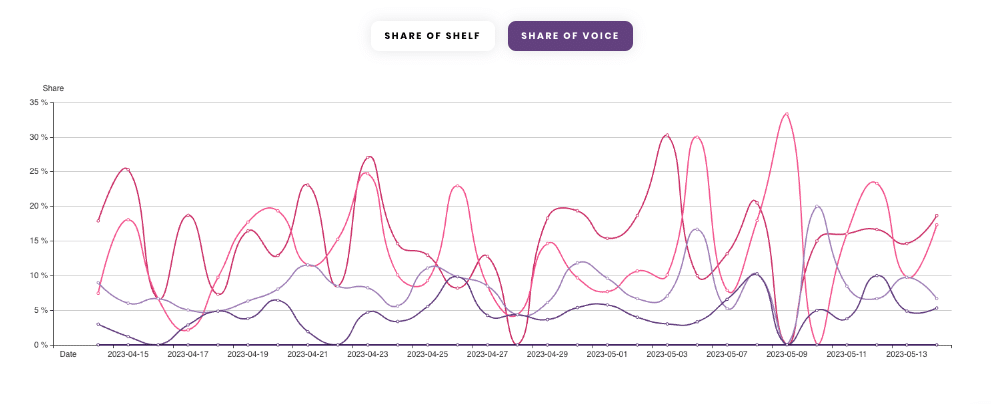
You can instantly understand how your brand or products perform against the competitors and what actions to take in case your SOV or SOS drops.
Trellis offers more metrics for your brands and competitors to help you understand your market share:
- Average ranking position
- Ranking keywords
- Price range
- Average product rating
- Average number of reviews
- Number of listed ads
- Average ad position
Closing thoughts
By consistently tracking your Amazon SOV and SOS on Amazon, you can assess your market share and dominance in a category or keyword search. Combining market share analysis with other KPIs such as ROAS can put your brand in a stronger position to make better decisions.
If you want to learn more about our platform, book a demo with our experts.